Grafana
Introduction
Grafana is an open-source platform for monitoring and observability. Use it to view dashboards and explore traces, logs, and metrics.
Tutorial
Open the Explore page (left menu) and select a data source:
- AMCS Loki - logs
- AMCS Mimir - metrics
- AMCS Tempo - traces
Each has separate sources for Development (DEV), Staging (STG), and Production (PRD).
Monitoring
To check data coming from the DCS add a label filter for the service_name:
- gdcc-api
- gdcc-backend
- gdcc-roadnet-manager
Example (API logs in production) shown below:
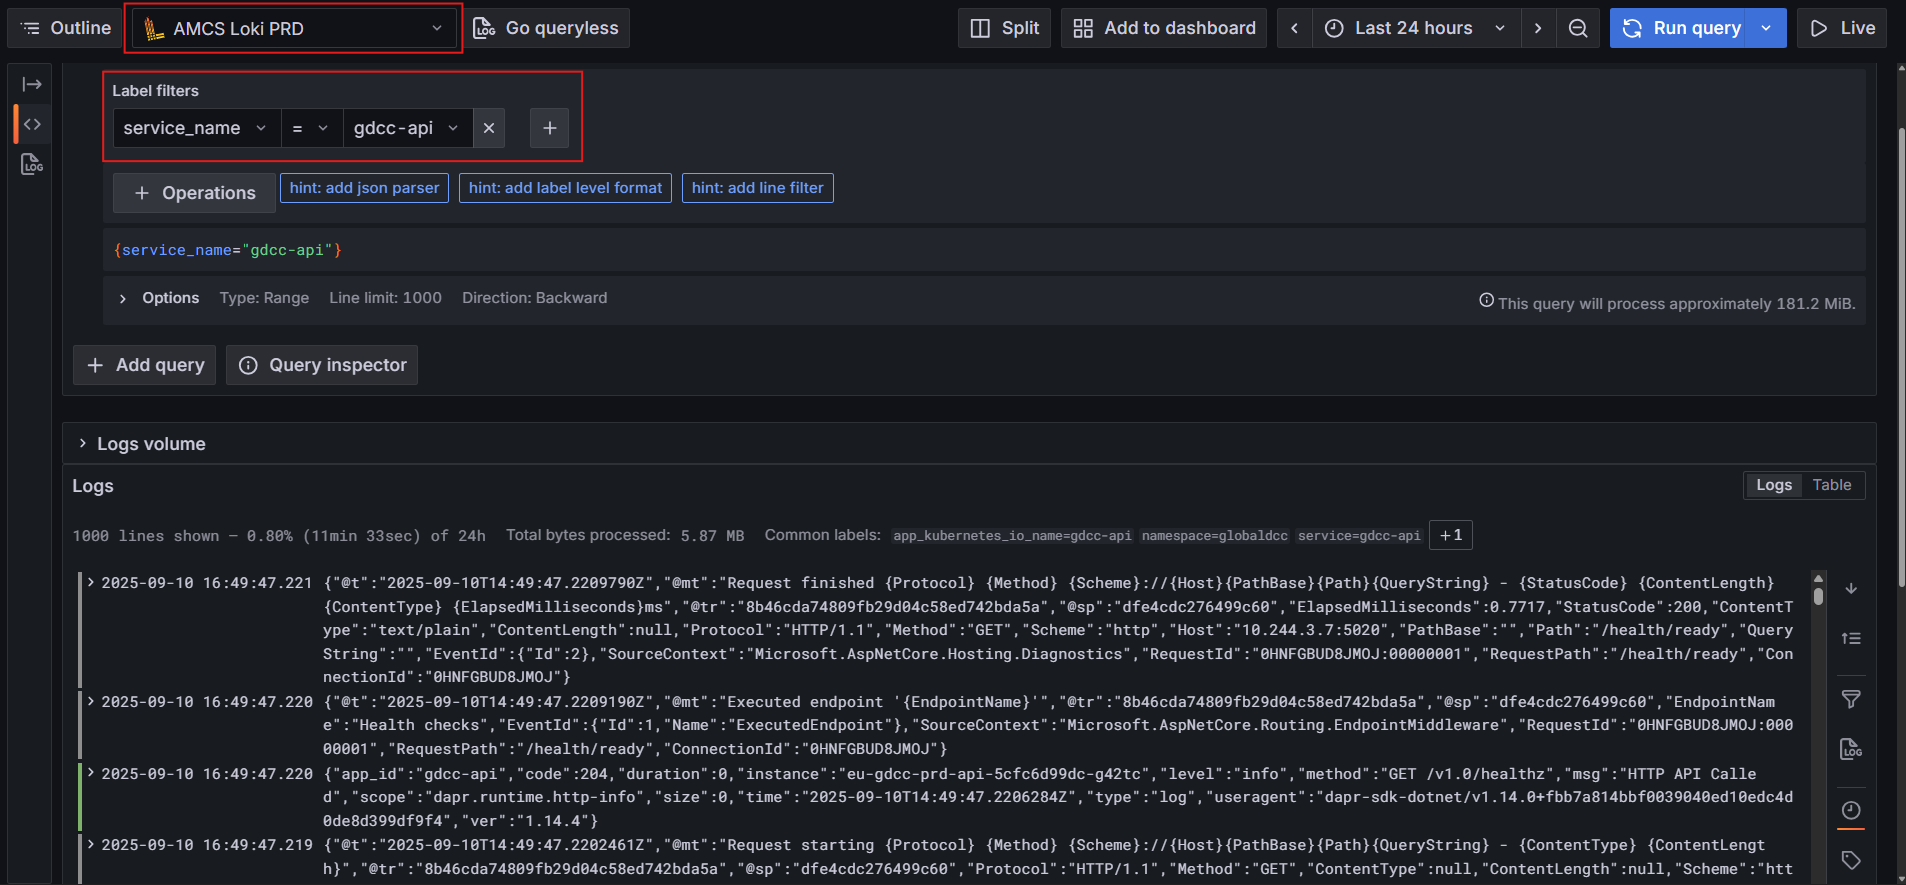
You can then add more labels or free‑text search to narrow results (errors, pod, etc.).
Dashboards
- Use Dashboards > Browse to find existing ones.
- Global DCC dashboard
- You can create new dashboards on Dashboards > new
- From Explore you can Add to dashboard to save an useful query.